Maintaining and Improving Sigma Performance on VITROS 5600: A Positive QC Story from Yashoda Hospitals, Secunderabad
Dr Madhavi Devalaraju, Dr. Rajkumar Rathod
1. Sr. Consultant Biochemist
2. Group Head- Laboratory & Transfusion Medicine, Department of Laboratory Medicine, Yashoda Hospitals, Secunderabad, India
APFCB News Volume 5, Issue 2
Introduction
Sigma metrics (σ) have become an essential tool in laboratory medicine for assessing analytical performance by integrating total allowable error (TEa), bias, and imprecision into a single measurable index. This unified approach facilitates the implementation of risk-based quality control strategies in accordance with CLSI C24 guidelines, enabling laboratories to optimize quality practices based on assay performance. Increasingly, the focus has shifted from merely identifying underperforming assays to demonstrating sustained performance and achieving continuous improvement. Emphasis on maintaining high sigma performance reflects robust laboratory quality systems and operational consistency. In this study, we evaluated sigma performance of two VITROS 5600 analyzers over defined periods in 2023 and 2024, with particular focus on stability across sigma bands and identification of analytes that demonstrated measurable improvement following targeted quality control interventions.
Methodology
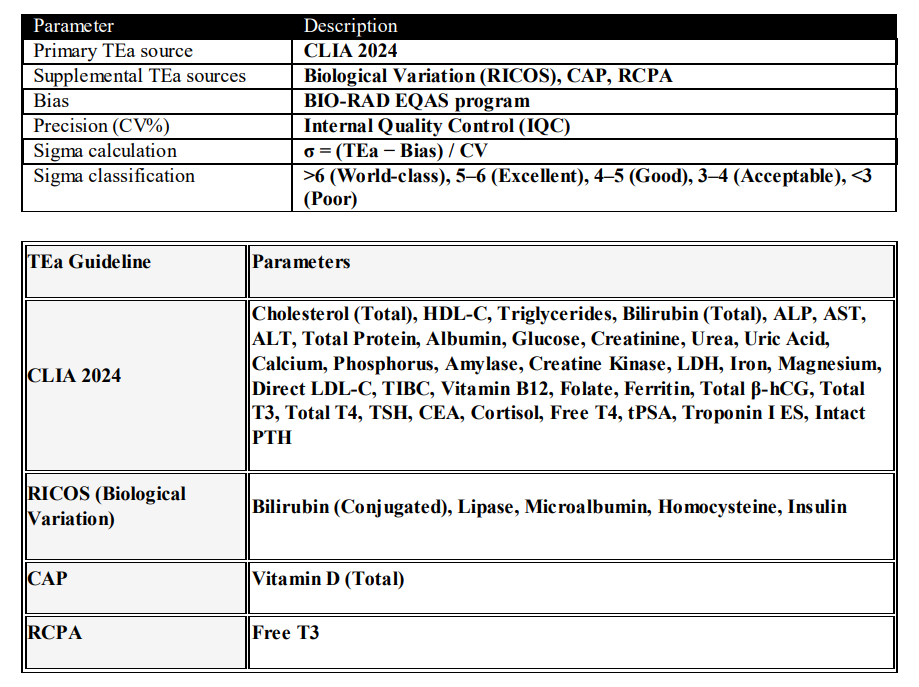
The study was conducted at the Department of Biochemistry, Yashoda Hospitals, Secunderabad. Analytical performance was evaluated using two VITROS 5600 analyzers, comprising a primary system (serial number 56004237) and a backup system (serial number 56000582). The analysis was conducted over two time periods: January–December 2023 and January–June 2024.Internal Quality Control (IQC) data from three levels (L1, L2, and L3) were used to determine imprecision (CV%) for each analyte, while Bias (%) was obtained from the BIO-RAD EQAS program. These parameters were used to calculate sigma (σ) for each analyte using the formula σ = (TEa − Bias) / CV. The average sigma value was derived by combining results across all IQC levels (L1, L2, and L3) and reporting the mean sigma per analyte. Sigma performance was classified into standardized categories as follows: >6 (world-class), 5–6 (excellent), 4–5 (good), 3–4 (acceptable), and <3 (poor).
A hierarchical approach was adopted for selecting Total Allowable Error (TEa). CLIA 2024 was used as the primary reference for routine chemistry and immunoassay parameters. For analytes where CLIA limits were unavailable, TEa was derived from biological variation data (RICOS database). In cases where both CLIA and RICOS limits were not available, alternative guidelines such as CAP and RCPA were used based on applicability and availability. For example, TEa for Vitamin D was adopted from CAP due to the absence of defined limits in CLIA and biological variation sources, while Free T3 was aligned with RCPA recommendations. This approach ensured consistent and clinically relevant TEa selection across all analytes.
Table 1. Analytical goals and calculation sources
Results
A total of 38 analytes were evaluated on the primary analyzer (VITROS 5600, serial number 56004237), while 20 analytes were assessed on the backup analyzer (VITROS 5600, serial number 56000582).
Primary System (56004237)
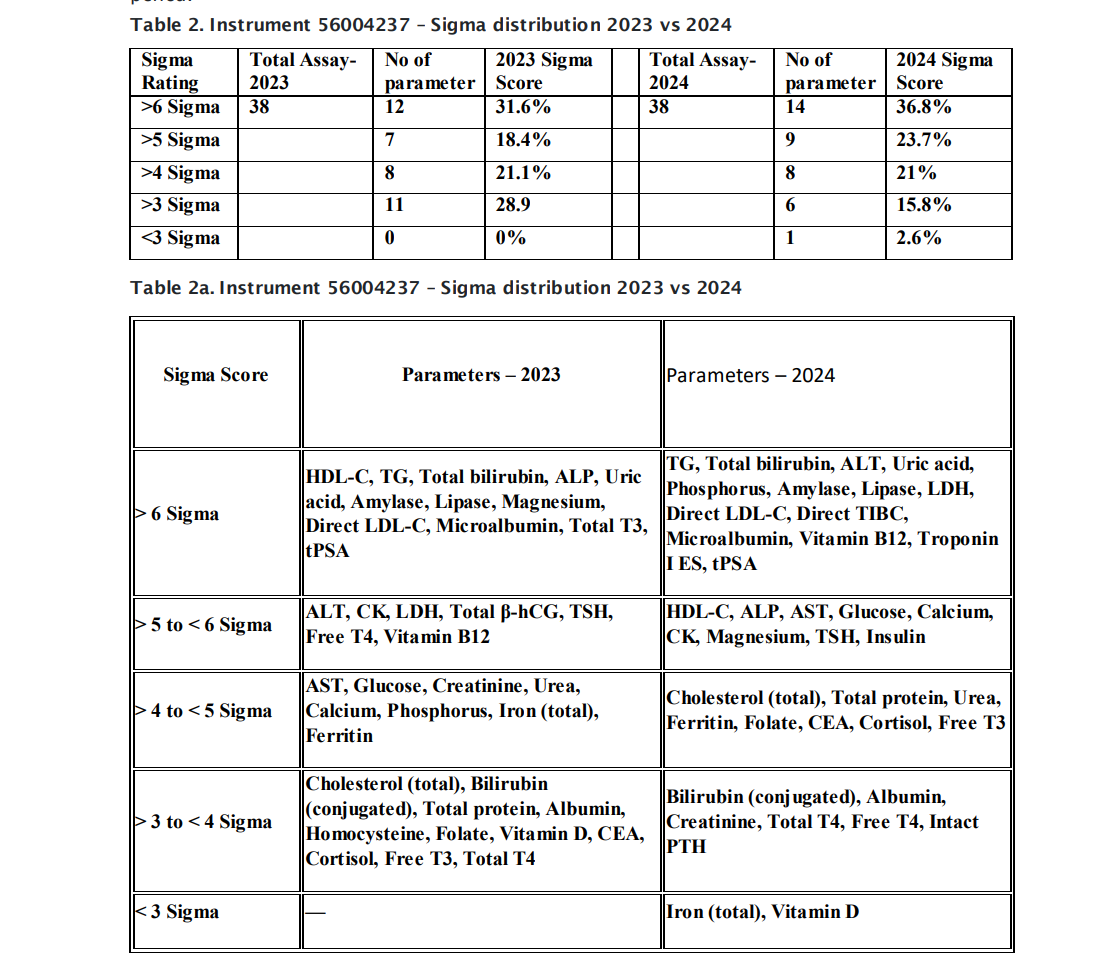
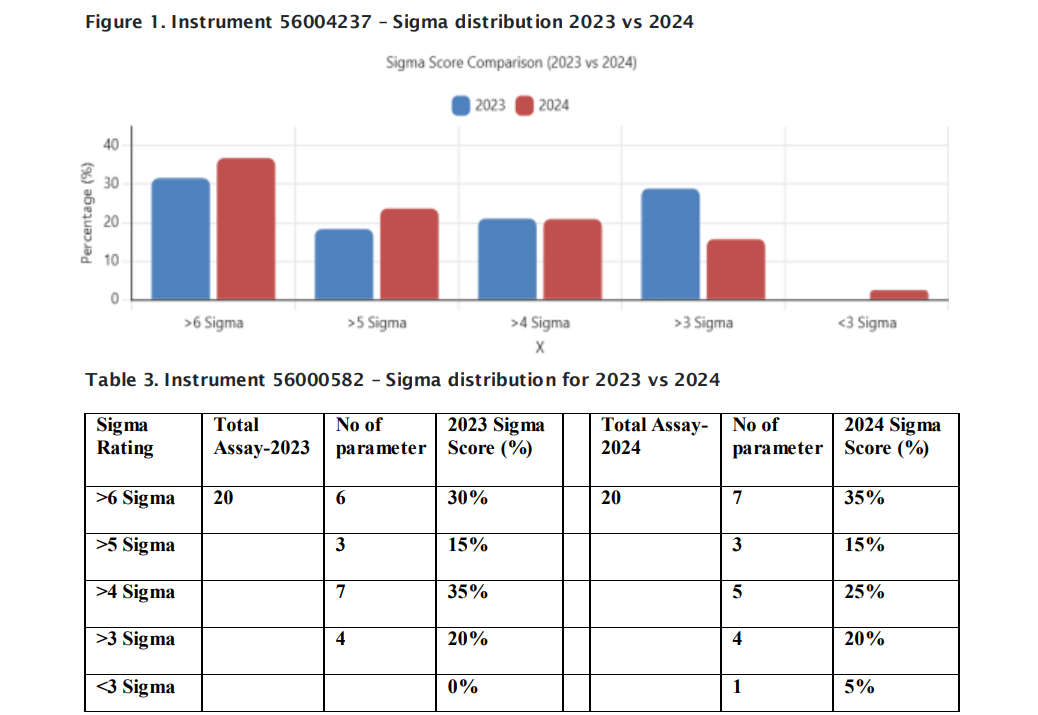
The sigma distribution for 2023 and 2024 is presented in Figure 1. An improvement in higher sigma categories was observed over time. The proportion of analytes in the >6 sigma category increased from 31.6% (12/38) in 2023 to 36.8% (14/38) in 2024. Similarly, the >5 sigma category increased from 18.4% to 23.7%. While the proportion of analytes in the 4–5 sigma category remained stable (~21%), a reduction was noted in the 3–4 sigma category (28.9% to 15.8%), indicating upward movement into higher sigma bands. A small proportion of analytes (2.6%) shifted into the 6 and 5–6 sigma categories.
Backup System (56000582)
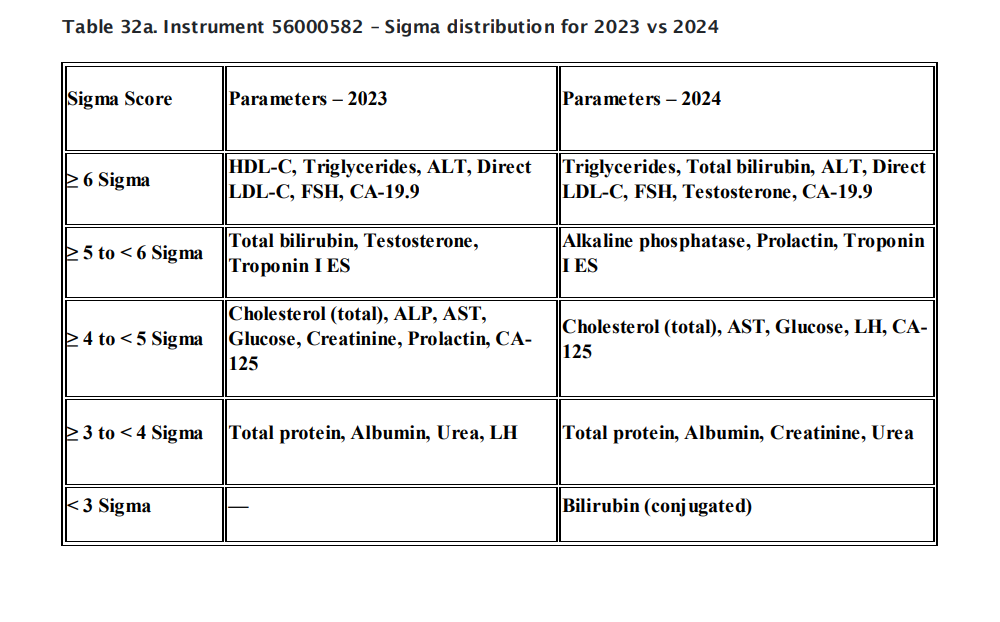
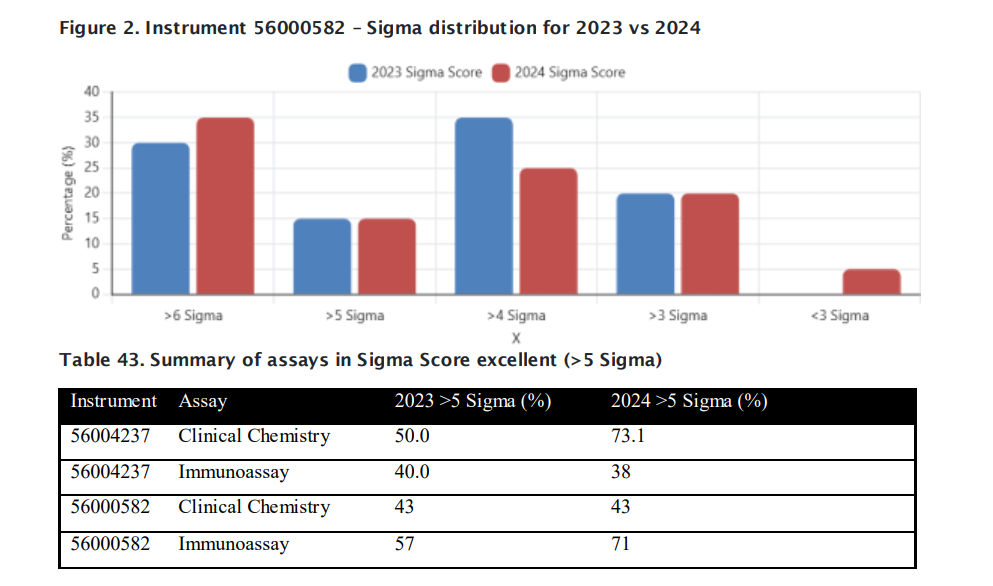
The sigma distribution for the backup analyzer is shown in Figure 2. For a total of 20 analytes, the >6 sigma category improved from 30% (6/20) in 2023 to 35% (7/20) in 2024, while the >5 sigma category remained stable at 15%. A reduction was observed in the 4–5 sigma category (35% to 25%), with corresponding redistribution into higher performance categories. The 3–4 sigma category remained unchanged at 20%, while a single analyte (5%) was noted in the <3 sigma category in 2024. The analyte-level distribution indicates overall stability with selective improvement in highperforming assays.
Summary of High Sigma Performance (>5 Sigma)
The proportion of assays achieving >5 sigma performance across instruments and assay types is summarized in Table 43. For the primary system (56004237), clinical chemistry assays showed a significant improvement in >5 sigma performance, increasing from 50.0% in 2023 to 73.1% in 2024, while immunoassay performance remained stable (40% vs 38%). For the backup system (56000582), clinical chemistry performance remained unchanged at 43%, whereas immunoassay assays demonstrated a notable increase from 57% to 71%. Overall, the results demonstrate maintenance of sigma performance with selective upward shifts into higher sigma categories across both systems, reflecting improved analytical quality over the study period.
Discussion
The present study highlights the effective application of sigma metrics in monitoring and improving analytical quality in a routine clinical laboratory setting. The observed improvement in higher sigma categories (>5 sigma), particularly across both analyzers between 2023 and 2024, reflects the impact of structured quality control interventions, including optimized IQC practices, calibration strategies, and reagent lot management. The adoption of a hierarchical TEa selection approach—utilizing CLIA as the primary reference, supplemented by biological variation (RICOS), CAP, and RCPA guidelines— ensured comprehensive and analyte-specific performance evaluation. Standardized sigma classification enabled risk-based quality control implementation in accordance with CLSI C24 recommendations, allowing efficient resource utilization while maintaining analytical reliability. Importantly, the study emphasizes sustained performance and targeted improvements rather than isolated deficiencies, demonstrating that disciplined quality processes can effectively enhance laboratory performance without increasing operational burden.
Conclusion
Across two VITROS 5600 instruments, Sigma performance was maintained year-over-year with visible improvements into the >5 Sigma band. The sustained quality profile demonstrates practical gains achievable through disciplined QC processes without focusing on declines. The sustained quality profile highlights the practical value of disciplined QC processes in maintaining high analytical performance while achieving improvements in selected analyses.
Author Contributions
All authors contributed substantially to the study design, data collection, analysis, and manuscript preparation. All authors reviewed and approved the final version of the manuscript.
Funding
No external funding was received for this study.
Conflict of Interest
The authors declare no conflicts of interest
1. Clinical Laboratory Improvement Amendments (CLIA). 2024 CLIA requirements [Internet]. Available from: https://westgard.com/clia-and-quality-regulation-requirements/qualityrequirements/2024-clia-requirements.html [accessed April 2026].
2. Ricos C, Alvarez V, Cava F, et al. Biological variation database [Internet]. Available from: https://www.westgard.com/biodatabase1.htm [accessed April 2026].
3. College of American Pathologists (CAP). Proficiency Testing Standards and Acceptable Limits; 2024.
4. Royal College of Pathologists of Australasia (RCPA). Allowable limits of performance for biochemistry tests [https://dataanalysis.rcpaqap.com.au/analytical-performancespecifications/]. [accessed April 2026].
5. A Kirsch, R Lesiv, Ortho Clinical Diagnostics Rochester, New York;M Barba Laboratory Diagnostics Consulting, Atlanta, Georgia. Comparative Study of Six SigmaAssay Performance on VITROS® Systems. AACC Annual Meeting & Clinical Lab Expo July 31–August 4, 2016.
6. Lakshman M, Reddy BR, Bhukani P, Malathi K, Salma M. Evaluation of sigma metrics in a medical biochemistry lab. International Journal of Biomedical Research 2015; 6(03): 164-171.
7. Chakravarthy S, Ramanathan S, Smitha S, Vijayakumar KV, Nallathambi T, Selvaraj M. Phoenix in the lab: The sigma metrics during Chennai’s worst disaster: Monitoring and management of the Quality Management System (QMS). APFCB News. 2026;5(1).
8. B. Vinodh Kumar, Thuthi Mohan. Sigma metrics as a tool for evaluating the performance of internal quality control in a clinical chemistry laboratory. Journal of Laboratory Physicians - Volume 10, Issue 2, April-June 2018 199
9. Nibedita Sarma, Subhosmito Chakraborty. Effectiveness of six sigma score analysis of clinical biochemistry parameters in a newly installed automated analyzer– Retrospective analysis in a tertiary cancer care centre. International Journal of Clinical Biochemistry and Research 2023;10(1):81–86
10. Pinki Mayankkumar Joshi, Urmi Kalrav Patel1. Performance evaluation of routine analytes using six sigma principle in a stand-alone clinical laboratory. International Journal of Clinical Biochemistry and Research 2022;9(2):127–134
11. Bais B, Singh K, Tripathi V, Kheirnar C. Sigma performance evaluations for clinical chemistry and immunoassays in a tertiary care hospital laboratory based on Clinical Laboratory Improvement Amendments (CLIA) 1988 and 2024 guidelines. Int J Clin Biochem Res. 2024;11(2):129–141.